
Wasserstein Regimes
What market-state information is lost when a return window is compressed into volatility or a few moments?
This research compares full empirical return distributions with volatility, moment and dependence baselines. Synthetic controls establish what the representations can distinguish; chronological market studies test their stability and forecasting value.
Marginal clusters mostly reflect scale
In SPY, 97.87% of raw-W2 training-centroid separation is scale. Holdout assignments closely agree with volatility-only clustering (ARI 0.990). Independent QQQ, TLT, GLD and HYG studies find 95.27–97.53% scale contribution. Shape stability is mixed; TLT and HYG occupy only one raw holdout state.
Full distributions separate exact matched-four-moment synthetic laws. That capability does not establish incremental market information or predictive value from shape. ARI measures agreement, not accuracy; identical single-state assignments can produce ARI 1.
Joint information is detectable; empirical partitions remain fragile
Joint sliced-W2 medoids distinguish dependence changes missed by marginal representations, including a constructed control with identical covariance. Correlation changes are also detected by covariance clustering, so correlation recovery alone establishes no distributional advantage.
In the market study, return-level resampling gives mean validation ARI 0.518. A seeded 1% extreme training contamination scenario collapses clean validation assignments to one state. Stationary nulls produce persistent clusters and novelty flags. These are sensitivity measurements, not confidence intervals or calibrated market hypothesis tests.
Risk forecasting shows no demonstrated advantage
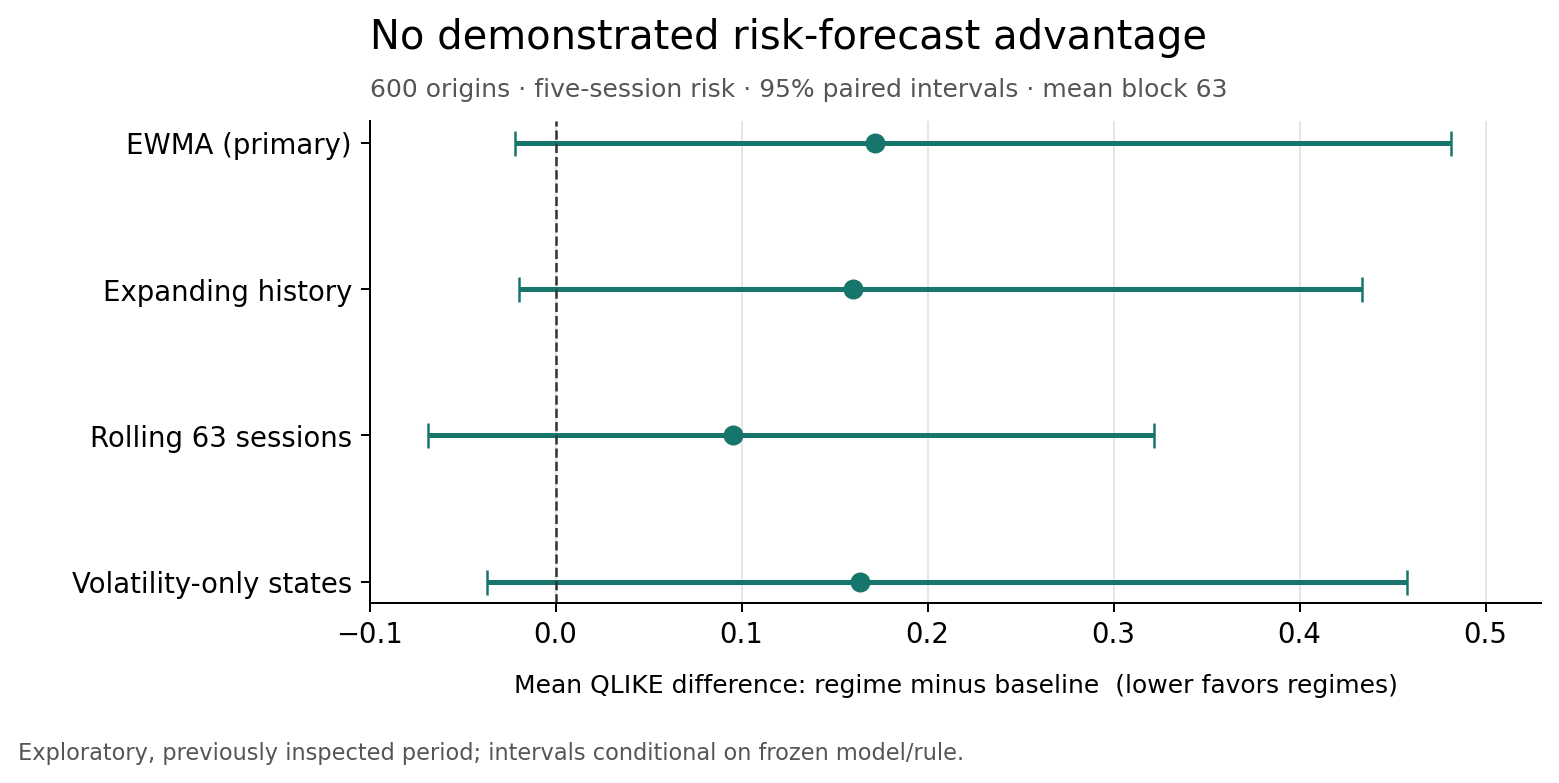
Across 600 scored five-session basket-risk forecasts, joint regimes have higher average primary QLIKE loss than expanding history, EWMA, rolling history and volatility-only states. The regime-minus-EWMA difference is +0.1715, with a paired 95% interval of [−0.0217, +0.4816]. Lower loss is better; the interval establishes neither superiority nor equivalence.
The target is the next five sessions' average daily squared simple return of an equal-weight SPY/QQQ/TLT/GLD/HYG basket: a conditional second moment, interpretable as variance only under zero conditional mean. Paired bootstrap intervals condition on the selected model and frozen forecasting rule; they exclude selection uncertainty and do not guarantee coverage under nonstationarity.
Published studies
| Study | Evidence |
|---|---|
| Univariate market regimes | SPY geometry, baseline agreement, overlapping-window nulls and synthetic recovery |
| Cross-asset replication | Independent QQQ/TLT/GLD/HYG fits, occupancy and shape stability |
| Joint dependence controls | Representational capability beyond marginals and covariance; measured computation |
| Joint market panel | Six models on 605 shared windows; conditional window-refit mean ARI 0.521 |
| Robustness and failure modes | Return resampling, stationary nulls, rare transitions and contamination |
| Frozen inference and execution | 690/690 validation labels reproduced; all 11 jobs resume from verified artifacts |
| Risk forecasting | Frozen target, all baseline comparisons and dependence sensitivities |
Each study reports limitations, source identities and aggregate artifact checksums. Execution measurements establish reproducibility and resource use, with no implication for regime stability or prediction.
Methods and research context
Exact one-dimensional W2 clustering uses every order statistic and mean quantile barycenters; W1 uses median barycenters. Joint models use finite-projection sliced W2 and sampled observed-window medoids, an approximation to sliced geometry rather than a full multivariate W2 solver. Both representations discard temporal order within each window; chronological assignment does not recover it.
Read the methods, frozen market, robustness and risk protocols, Research agenda and motivating paper review. Next questions include temporal-order controls, source validation and confirmation on newly reserved observations.
Reproduce the evidence
- Univariate study workflow
- Frozen scoring and experiment workflow
- Risk forecasting workflow
- Data sourcing, schemas and availability assumptions
Market CSVs, observed medoids and per-origin audit rows remain local. Fresh downloads may differ from frozen hashes and cannot establish exact reproduction. Numerical sources, dependencies, configuration and input identities bind the saved evidence. The estimators require only NumPy; research commands need the research dependencies.
Scope and data rights
The joint market and risk studies reuse a previously inspected 2024–August 2026 period and are explicitly exploratory. Revised adjusted-close histories are not verified point-in-time archives. Overlapping windows, correlated assets and sparse state occupancy limit inference; cross-provider validation remains open. No trading profitability or executable-close claim follows from these results.
Motivated by Horvath, Issa and Muguruza's Clustering Market Regimes using the Wasserstein Distance. These independent daily studies do not reproduce the paper's hourly experiment.
Original code and documentation are GNU GPL v3 only (GPL-3.0-only); see LICENSE. Third-party data and papers retain their own terms.