Exploratory risk forecast results
The frozen regime-conditioned forecast did not demonstrate an advantage over simple baselines. It had higher average primary QLIKE loss than all four comparators. The regime-minus-EWMA difference was +0.1715, with a paired 95% interval of [−0.0217, +0.4816]. Zero remains inside the interval; this is neither evidence of superiority nor proof of equivalence.
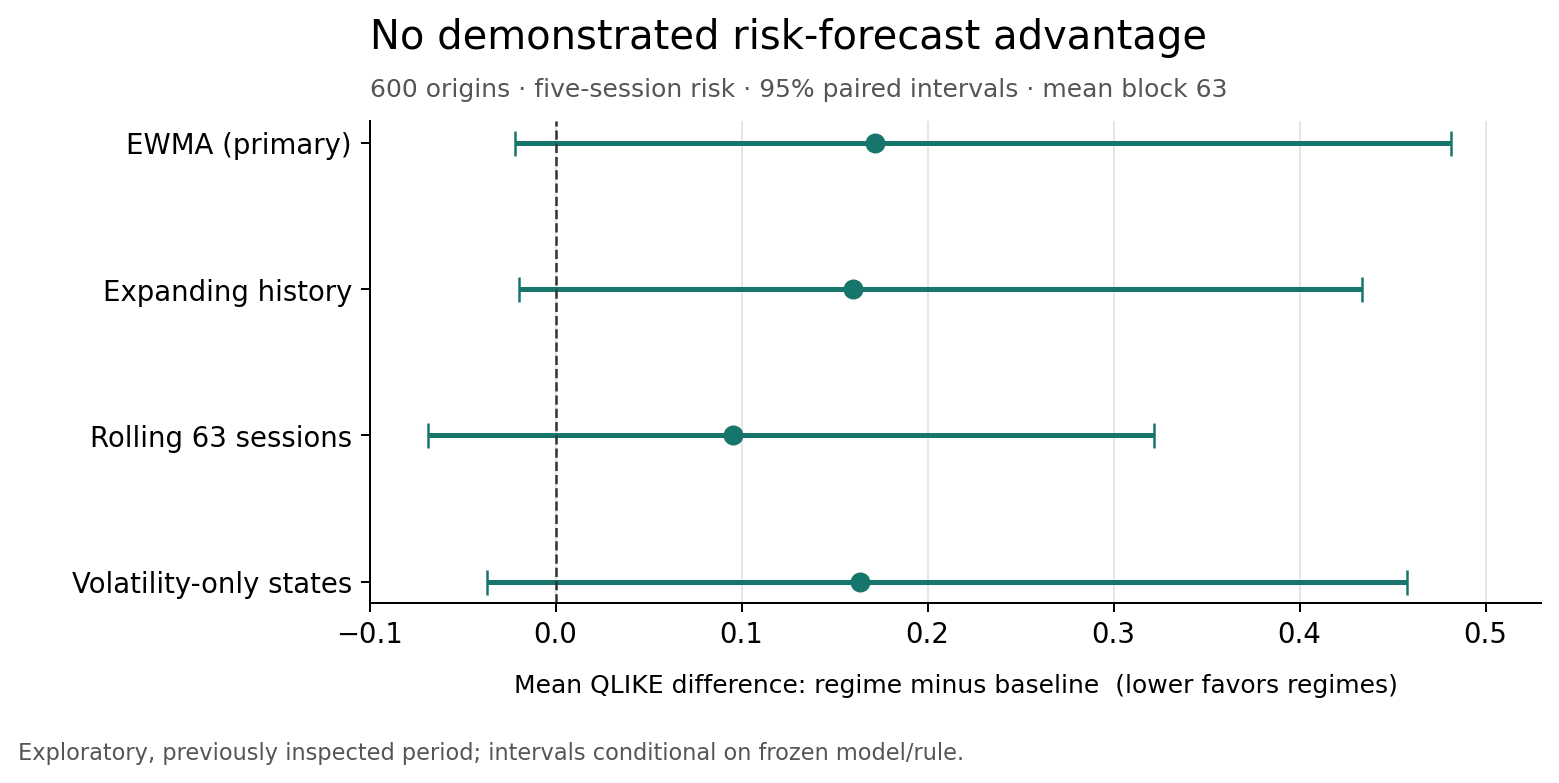
The protocol was committed before inspecting these losses. It fixes the target, model, shrinkage, EWMA decay, proper losses, comparator and bootstrap choices. No settings changed after seeing the results. The 2024–August 2026 period had already been inspected in earlier research, so this is exploratory. Revised adjusted-close data do not establish point-in-time forecasting performance.
What was tested
The existing K=3, training-scaled, 63-session joint sliced-W2 medoid model remained frozen. Selection ended December 2023. At every eligible origin, forecast the next five sessions' average daily squared simple return of an equal-weight, daily-rebalanced SPY/QQQ/TLT/GLD/HYG basket. This directly targets a conditional second moment; a variance interpretation additionally assumes zero conditional mean. It is not squared five-day cumulative return or intraday realized variance.
State-conditioned means use only matured outcomes and shrink toward expanding history with 252 pseudo-observations. The volatility-only control uses the same estimator with training-frozen tercile bins of trailing basket risk. EWMA uses decay 0.94. All methods receive the same observation prefix and are evaluated on identical targets/origins. Forecasts become available after the close; no execution at that already-observed close is assumed.
- Common return history: April 12, 2007–August 31, 2026.
- 63 requested origins were purged because their raw-price intervals overlap model calibration.
- 605 forecasts were produced; 600 have fully matured targets.
- Scored origins: April 3, 2024–August 24, 2026. Target maturities: April 10, 2024–August 31, 2026.
- The final five forecasts remain pending. No scored forecasts required the numerical floor.
Losses and forecast levels
QLIKE is log(f) + y/f, without target-only constants. Smaller is better; negative absolute values are expected and should not be converted into percentage improvements. MSE is secondary, with the displayed values multiplied by one billion. Mean targets and forecasts are daily squared-return fractions multiplied by 100,000.
| Method | Mean QLIKE | MSE × 10⁹ | Mean forecast × 10⁵ |
|---|---|---|---|
| Joint regime | -8.812028 | 8.232027 | 3.3221 |
| Expanding history | -8.971907 | 7.863840 | 4.3425 |
| EWMA (primary comparator) | -8.983554 | 8.531810 | 4.5790 |
| Rolling 63 sessions | -8.907488 | 8.623552 | 4.5064 |
| Volatility-only states | -8.975779 | 7.923810 | 5.0540 |
The common mean target was 4.6490 × 10⁻⁵, above the joint-regime mean forecast of 3.3221 × 10⁻⁵. The state-based forecast underestimated risk on average. Secondary MSE ranks regimes ahead of EWMA and rolling history, but behind expanding history and volatility-only states; it does not overturn the prespecified primary comparison.
Paired uncertainty and dependence sensitivities
Differences are regime minus baseline. Negative favors regimes. The primary mean block length is 63 forecast origins; 20 and 126 were prespecified sensitivities. Each interval uses 2,000 circular stationary-bootstrap replicates with paired shared draws, seed 2026.
| Comparator | QLIKE difference | 95% interval, block 20 | 95% interval, block 63 | 95% interval, block 126 |
|---|---|---|---|---|
| Expanding history | +0.1599 | [-0.0208, +0.4308] | [-0.0197, +0.4337] | [-0.0072, +0.3951] |
| EWMA (primary comparator) | +0.1715 | [-0.0354, +0.5115] | [-0.0217, +0.4816] | [-0.0138, +0.4471] |
| Rolling 63 sessions | +0.0955 | [-0.0859, +0.3470] | [-0.0684, +0.3215] | [-0.0567, +0.2801] |
| Volatility-only states | +0.1638 | [-0.0442, +0.4818] | [-0.0370, +0.4577] | [-0.0203, +0.4084] |
Every primary-loss interval includes zero across these sensitivities. These are pointwise intervals conditional on the selected model and fixed forecasting rule. They are not simultaneous bands, multiplicity-adjusted tests, or guarantees of coverage under nonstationarity. Overlapping targets, 63-session windows, model selection, data revisions and a short assessment all limit inference. Bootstrap resamples loss differences; it does not repeat training or selection.
| Comparator | MSE difference × 10⁹ | 95% interval × 10⁹, block 63 |
|---|---|---|
| Expanding history | +0.3682 | [-0.0806, +1.0563] |
| EWMA (primary comparator) | -0.2998 | [-1.3514, +0.6171] |
| Rolling 63 sessions | -0.3915 | [-1.4465, +0.3978] |
| Volatility-only states | +0.3082 | [-0.4027, +1.2762] |
Year slices are descriptive, grouped by origin year; 2024 and 2026 cover partial years. They are not separate model-selection sets.
| Origin year | Origins | Regime QLIKE | EWMA QLIKE | Difference |
|---|---|---|---|---|
| 2024 | 189 | -9.2711 | -9.2393 | -0.0319 |
| 2025 | 250 | -8.6473 | -9.0124 | +0.3651 |
| 2026 | 161 | -8.5289 | -8.6385 | +0.1096 |
Occupancy and scope
The scored joint states have counts [0, 110, 490]; one fitted state is absent. The volatility-only bins have counts [55, 237, 308]. Historical matured-target support ranges from 1,140 to 3,389 for the current joint state, versus 1,176–1,944 for volatility bins. These overlapping historical counts are not independent effective sample sizes. Support size does not establish regime stability; preceding robustness failures still apply.
This study evaluates one existing classifier and one frozen mapping to basket risk. It does not rule out every distribution-based forecast or establish an incremental tail/dependence benefit. No covariance-matrix, tail-risk, allocation, transaction-cost or trading-profit claim is made. A confirmatory successor needs newly reserved observations and point-in-time/source validation. The research agenda includes controlled tests of path-order blindness; this exposed assessment must not be reused to tune a forecasting advantage.
Verification and provenance
Before empirical evaluation, the implementation passed 241 tests and a strict documentation build. Validation covers forecast-origin boundaries with later target observations, consecutive exchange-session intervals, closing-return availability and shared bootstrap draws. These checks support implementation correctness; they do not remove the statistical or data limitations above.
The empirical worker completed in 2.45 seconds, with 249.6 MiB process-lifetime high-water RSS including imports/input arrays, on macOS arm64, Python 3.11.5, one worker/one BLAS thread. This is one measured run, not a performance guarantee. The second invocation was a verified cache hit on the identical attempt. Its complete inventory and all 600 aggregate loss calculations were checked against the saved local forecast table.
Read the reproduction workflow. Aggregate evidence and checksums contain all losses, block sensitivities, yearly slices, source/dependency fingerprints and run identities. Market observations, medoids and per-origin audit rows remain local.
- Frozen protocol: commit
4ce3b1b. - Executed source:
8b2e235. - Job:
85c278f917529d74aaca39039240efc3de566b60ee4798aea99ae00abf147a12. - Attempt:
33af7077cc4341a986abbeb4285c69eb. - Sealed attempt inventory digest:
eb4e5a6af038fadd8a1785e48704aa73d18c664725b39c5e210b2ee5c76a820a.