Cross-asset replication results
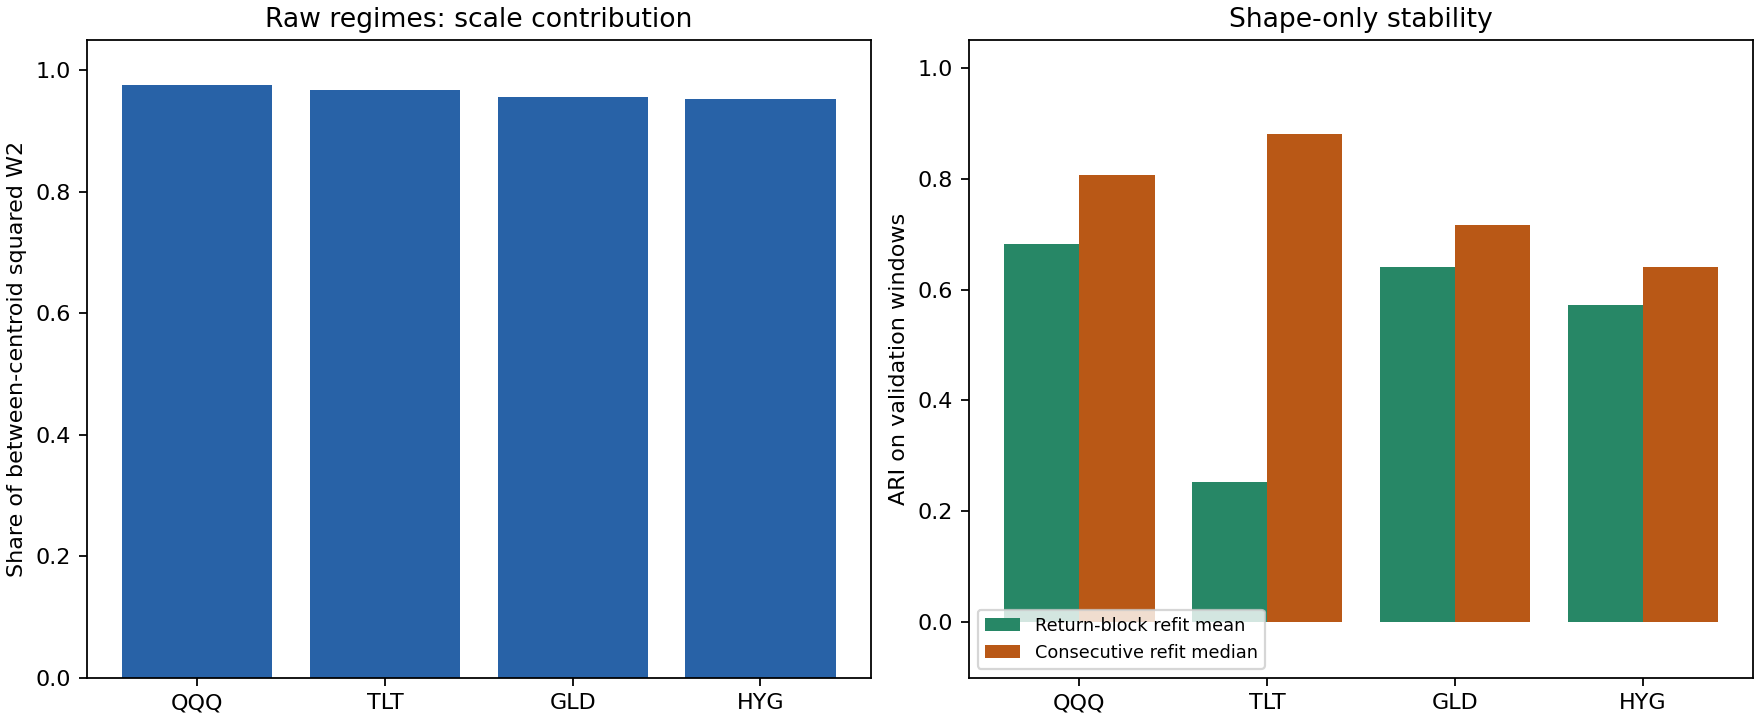
The frozen SPY methodology was replicated independently on QQQ, TLT, GLD and HYG. Scale accounts for 95.27–97.53% of raw-W2 centroid separation across all four assets. Shape-only stability is mixed, and incremental predictive value remains untested.
Measured comparison
| Asset | K | Scale share | Raw/volatility ARI | Shape block ARI | Shape refit median ARI | Raw occupied states |
|---|---|---|---|---|---|---|
| SPY (prior study) | 3 | 97.87% | 0.990 | 0.664 | — | 2 |
| QQQ | 3 | 97.53% | 0.939 | 0.683 | 0.807 | 2 |
| TLT | 2 | 96.76% | 1.000 | 0.254 | 0.880 | 1 |
| GLD | 4 | 95.63% | 0.727 | 0.640 | 0.717 | 4 |
| HYG | 4 | 95.27% | 0.000 | 0.573 | 0.641 | 1 |
Scale share describes training-centroid geometry. Raw/volatility ARI describes assignments on 605 strict holdout windows per asset, from 2024 through August 2026. Shape block ARI is the mean of 20 return-block refits scored on validation windows; shape refit median compares five consecutive saved-model pairs on the later model's validation windows. These are distinct diagnostics, not interchangeable estimates or confidence intervals. SPY is the unchanged earlier study; its consecutive-refit median was not computed here.
What the evidence supports
Raw transport clusters largely reflect scale, but high scale contribution does not guarantee identical volatility partitions. GLD has raw/volatility ARI 0.727. HYG has ARI 0.000 while its raw model assigns every holdout window to one state. TLT also occupies only one raw state: its ARI of 1.000 reflects two constant partitions, not successful identification of multiple regimes. QQQ occupies two of three raw states; GLD occupies all four.
Shape-only clustering produces multiple occupied states in every asset, but its stability depends on both asset and perturbation. Block-refit mean ARIs range from 0.254 for TLT to 0.683 for QQQ. TLT's consecutive-refit median is much higher (0.880), illustrating why one stability measure is insufficient. The 20-replicate block ARI ranges are QQQ 0.082–0.889, TLT −0.036–1.000, GLD 0.383–0.853 and HYG 0.283–0.745; these ranges are descriptive, not confidence intervals.
Consecutive shape-refit medians range from 0.641 to 0.880. All five comparisons per asset are nondegenerate under the prespecified both-single-state flag. Individual refits are less stable than their medians can suggest: GLD reaches ARI 0.196 and HYG 0.244. GLD's least occupied holdout shape state contains only four of 605 windows. Full per-period occupancy, refit ARIs, changing K and overlap diagnostics remain in the aggregate evidence.
This replication supports retaining shape-only clustering as a research diagnostic. It does not justify treating the states as universally stable or useful for trading or risk prediction. A future predictive study would need a separately frozen target, chronological evaluation, baseline comparison and treatment of overlapping outcomes before inspecting its test results.
Frozen method and provenance
The protocol was committed before evaluating these assets in commit cac499d; snapshot configurations in e52a14b. Each asset uses 63-return empirical distributions, fit stride 5, daily scoring, K=2–5 selected by validation raw-W2 silhouette, 20 empirical restarts and the same nine models as SPY. Five development test years (2019–2023) precede the fixed holdout. No pooling or asset-specific tuning was introduced.
Development runs used 9800309; holdout execution used e6c2a15, which changed the command's default to development and preserved acquisition metadata, without changing estimators. Consecutive-refit comparisons reload saved models without fitting. Equal-K centroids are matched; different-K comparisons retain ARI without claiming a centroid bijection.
Prices are revised Yahoo Finance adjusted closes retrieved through yfinance 1.7.0 on September 21, 2026. They are not point-in-time histories. Every asset has complete expected exchange-session coverage through August 31, 2026. Training starts at each ETF's own inception, so history length and asset class are confounded. ETF observations are correlated; four assets are not four independent statistical replications. Daily windows overlap. No inferential significance or forecasting claim follows from this table.
| Asset | First price | Observations | Development run | Holdout run |
|---|---|---|---|---|
| QQQ | 1999-03-10 | 6912 | a362eb771be46ffab5b4 |
b6078427d1de65e10274 |
| TLT | 2002-07-30 | 6061 | cbf040d3c347b0580e84 |
4a1ea5c823e12a564f10 |
| GLD | 2004-11-18 | 5479 | 7acc75f00006c383621c |
28562cebe13075097ea3 |
| HYG | 2007-04-11 | 4879 | 30f950c58235634d3186 |
cf8f61605d527b4ef196 |
Acquisition timestamps, full snapshot hashes, model manifests, aggregate fold metrics and refit comparisons are published in the aggregate evidence. Raw prices and per-window market observations remain local. All eight sealed run artifacts passed checksum verification; the public aggregate files have their own checksum inventory.
Reproduction
Install the research and data extras, acquire each asset with scripts/download_spy.py --symbol TICKER (see its --help), and use the frozen configurations under configs/cross_asset/. Live downloads can revise historical prices and will not necessarily match the recorded hashes. Do not replace a frozen hash silently.
regimes cross-asset --config configs/cross_asset/study.yaml --stage development
regimes cross-asset --config configs/cross_asset/study.yaml --stage holdout
The second command requires verified development artifacts matching every frozen configuration. Omitting the stage defaults to development. Explicit --stage all runs development for all assets before opening any holdout. The command writes an index, per-asset reports, a comparison CSV, a figure and a self-contained HTML report. Per-run manifests record the actual execution environment and source identity.